30-Day Mortality Rates in Hospital Scoring
The CMS Overall Star Ratings mortality domain score versus condition-specific mortality for common but unmeasured conditions
Many people may be familiar with the Centers for Medicare & Medicaid Services (CMS) Five-Star Quality Rating System, and specifically with the Overall Hospital Quality Star Rating (Overall Star Rating) program. This public hospital rating program assigns U.S. hospitals a numerical rating ranging from the best possible rating of five stars to the worst rating, one star. These ratings are based on sets of process of care measurements, outcome measurements and self-reported patient experiences. Typically, around 10% of hospitals achieve a five-star rating.
Many patients decide where to seek care based on these ratings. However, the ratings do not always present a full or relevant picture. Patients and their caregivers may be unfamiliar with how hospital data and outcomes are used to calculate these ratings.
For example, they may not know that 22% of a hospital's calculated CMS Overall Star Rating comes from its rates of "30-day mortality," which is defined as the percentage of patients who die within 30 days of being admitted to the hospital. Yet, hospitals' 30-day mortality rates are assessed only for six conditions and procedures:
- Acute myocardial infarction
- Chronic obstructive pulmonary disease
- Coronary artery bypass grafting
- Heart failure
- Pneumonia
- Stroke
Collectively, however, these six conditions account for fewer than 1 in 5 Medicare inpatient encounters.
This begs the question: Do these six conditions combine to give a fair estimation of hospitals' mortality rates for other conditions? The Science of Quality Measurement team used CMS inpatient claims data from 2016-2018 to test this question among a common group of conditions that account for hundreds of thousands of annual Medicare inpatient encounters — that is, mental diseases and disorders or psychoses.
To examine the data in ways similar to CMS risk-adjustment methodologies, the team limited its study to all U.S. hospitals with at least 25 mental health inpatient admissions during the two-year period in question. Researchers calculated hospitals' risk-adjusted 30-day mortality performance while adjusting for:
- Age
- Sex
- Elixhauser index, which accounts for patients' existing level of comorbidity or illness
- Medicare-severity diagnosis related grouping (MS-DRG)
The result was a predicted-versus-expected (P/E) ratio for each hospital, with a P/E of less than 1.0 indicating better performance than expected and a P/E of greater than 1.0 indicating worse performance than expected.
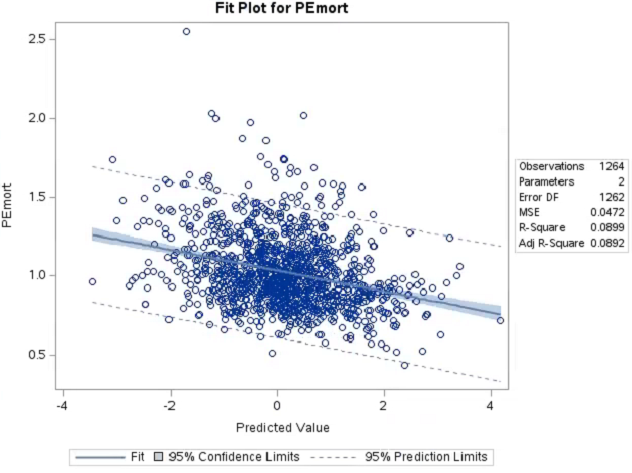
Using the CMS 6-digit hospital provider number, the team assessed the correlation between hospitals' 2021 CMS Overall Star Rating mortality domain scores and their mental health 30-day mortality P/E. The result from 1,264 eligible hospitals was an r-squared value of only 0.09 (Figure 1). In layman's terms, this means only 9% of hospitals' risk-adjusted mental health 30-day mortality can be explained by the CMS Overall Star Rating mortality domain.
Figure 1: Correlation plot for mental health 30-day mortality P/E (y-axis) and CMS mortality domain score (x-axis)
Figure 1: Correlation plot for mental health 30-day mortality P/E (y-axis) and CMS mortality domain score (x-axis)

Figure 1: Correlation plot for mental health 30-day mortality P/E (y-axis) and CMS mortality domain score (x-axis)
Figure 1 legend: n=1,264 eligible U.S. hospitals; y-axis shows mental health 30-day mortality P/E (>1.0 worse than expected; <1.0 better than expected); x-axis shows 2021 CMS Overall Star Rating mortality domain score (>0 is better performance, <0 is worse performance).
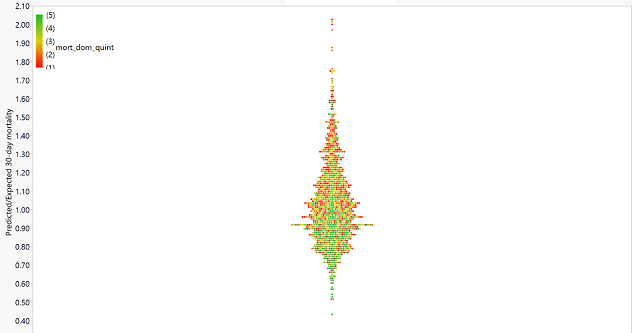
To put it another way, 91% of the hospitals' mental health 30-day mortality rates can be explained by factors other than CMS Overall Star Rating mortality domain score. Figure 2 shows how mental health 30-day mortality P/E ratios were distributed by Overall Star Rating mortality domain quintiles.
Figure 2: Distribution of mental health 30-day mortality P/E (y-axis) by CMS mortality domain quintile
Figure 2: Distribution of mental health 30-day mortality P/E (y-axis) by CMS mortality domain quintile

Figure 2: Distribution of mental health 30-day mortality P/E (y-axis) by CMS mortality domain quintile
Figure 2 legend: Each dot represents one of 1,264 eligible U.S. hospitals. Color-scale: Green dots are hospitals performing in best quintile 2021 CMS Overall Star Rating mortality domain; red dots are performing in the worst quintile. If each hospital's CMS Overall Star Rating mortality domain were perfectly correlated with mental health 30-day mortality, the tree plot would show all green dots at the bottom, scaling uniformly to all red dots at the top. The substantial variation between the two (in other words, the lack of strong correlation) is demonstrated by the seemingly random mix of colors across the y-axis.
To take it one step further, the study team assessed what these variations might mean for a patient seeking mental health care in the real world. In this example, the team imagined that a hypothetical patient was seeking inpatient mental health care. This imaginary patient and their family conducted substantial consumer research using publicly available CMS mortality data and decided to select only hospitals that were in the top-performing CMS Overall Star Ratings category for 30-day mortality.
Researchers represented the patient's options by selecting a random sample of 50 hospitals in the top quintile of the CMS Overall Star Ratings mortality domain. In this sample, the team found that 17 out of 50, or 34%, of hospitals that were "high-performing" according to their existing 5-star ratings actually performed worse than the national average (P/E>1.00) for mental health 30-day mortality.
Therefore, despite the hypothetical patient's due diligence in limiting their scope to include very high-performing hospitals, there was still slightly greater than one-third chance of selecting a hospital that performed below average for the specific type of care they sought.
Take-home point: Hospital ratings such as CMS Stars could better incorporate outcomes for a wider range of conditions and procedures to measure hospital performance more accurately.
Contact